Why Your COGS Are Wrong: How Food Manufacturers Lose Margin Without Real-Time Cost Tracking
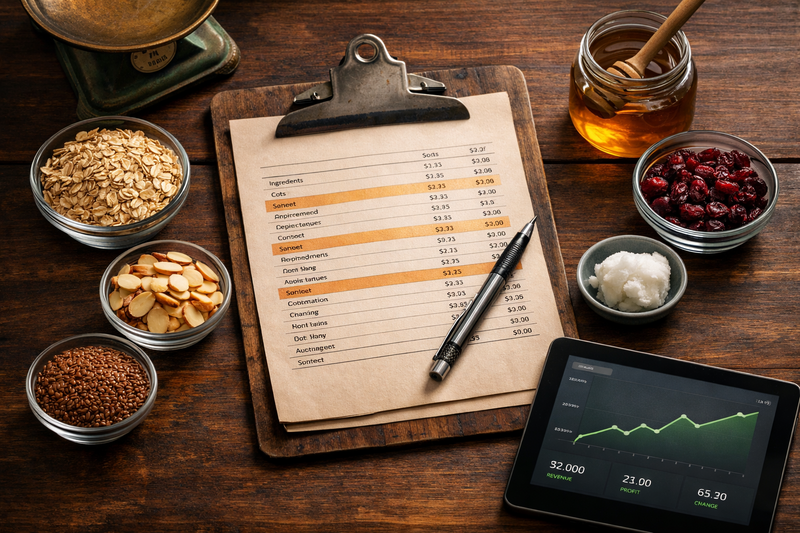
The Spreadsheet Problem
Most food manufacturers don't know their true cost of goods sold. Not in real time, anyway.
They know what they paid for ingredients last month. They have a rough idea of what each product should cost based on a recipe card that was last updated sometime in Q3. And they calculate margin at the end of the quarter by subtracting total purchases from total revenue and hoping the number is positive.
This is how margin leaks happen — not in a single dramatic event, but slowly, invisibly, across hundreds of orders where the actual cost of production drifted from what was assumed.
Why COGS Is Harder in Food Manufacturing
Generic businesses can calculate COGS with a simple formula: what you bought minus what's left in inventory. Food manufacturing doesn't work that way.
Ingredient costs fluctuate constantly. The price of flour, sugar, oils, and packaging materials shifts week to week. A cost-per-unit that was accurate in January may be 8-12% off by March.
Recipes consume multiple materials at precise ratios. A single finished product might require 15 raw materials, each measured in different units, each with its own cost trajectory. A granola bar isn't just "oats" — it's oats, honey, coconut oil, dried cranberries, flax seed, salt, vanilla extract, and packaging, all at specific quantities per unit.
Production variance is real. The BOM says you need 0.35 kg of almonds per batch. The production floor used 0.41 kg because the last delivery had smaller kernels. That 17% overuse goes unnoticed in a spreadsheet — but it compounds across thousands of units.
FIFO inventory means cost depends on which lot you consumed. If you have three lots of the same raw material purchased at different prices, the cost of your finished product depends on which lot was pulled first.
What "Real-Time COGS" Actually Means
Real-time COGS doesn't mean recalculating costs every millisecond. It means that every time an order is created, the system computes the actual cost based on current data — not a stale estimate from last quarter's spreadsheet.
Here's how it works in practice:
1. Every product has a versioned Bill of Materials (BOM).
Each BOM defines the exact quantity of every raw material needed to produce one unit. Not a PDF recipe card — a structured, versioned record that the system uses for calculations. When your recipe changes, you create a new BOM version. The old version stays for historical accuracy. Only the active BOM is used for new orders.
2. Every raw material carries a current cost-per-unit.
When ingredient prices change, you update the cost. Simple. But critical — because this is the number the system multiplies against your BOM quantities.
3. COGS is calculated at order time.
When an order is placed, the system walks through each product's active BOM, multiplies each ingredient's quantity-per-unit by its current cost-per-unit, sums the result to get the unit cost, then multiplies by the order quantity. That number is stored on the order as a historical snapshot.
The formula for each line item:
COGS = Order Quantity x SUM(BOM Item Quantity Per Unit x Raw Material Cost Per Unit)
This means last month's orders reflect last month's costs, and today's orders reflect today's costs. You're never comparing revenue against stale numbers.
4. Production variance is tracked separately.
After a production run, the system captures what was actually consumed versus what the BOM expected. Every ingredient gets an expected quantity, an actual quantity, and a variance — both in absolute terms and as a percentage.
This is where the real savings hide. A 5% overuse on your most expensive ingredient, repeated across 200 production runs, can erase an entire point of margin. You can't fix what you can't see.
From COGS to Margin — The Reports That Matter
Knowing your COGS per order is useful. Knowing your margin by customer, by product, and by time period is where decisions get made.
Sales reports with built-in margin: Every sales report shows revenue, COGS, gross profit, and margin percentage side by side. Filter by date range and you can see exactly how your profitability has trended — not as a quarterly surprise, but as a continuous signal.
Customer profitability: Not all customers are equally profitable. Some order high-margin products in large quantities. Others order low-margin SKUs with complex fulfillment requirements. When COGS is tracked per order and each order is linked to a customer, you can rank your customers by actual gross margin — not just revenue.
Top cost drivers: A COGS dashboard that surfaces your top 10 most expensive raw materials and your top 10 highest-cost orders gives you immediate visibility into where your money goes. When almond prices spike 20%, you see the impact in your next report — not three months later when the accountant reconciles.
Monthly trend analysis: Twelve months of COGS data plotted over time shows you seasonality, cost creep, and the impact of supplier changes. This is the kind of data that turns reactive purchasing into proactive negotiation.
The Cost Simulator: Pricing Before You Commit
One of the most overlooked tools in costing is the ability to simulate costs before an order exists.
A cost simulator lets you select products, specify quantities, and see the projected cost based on current BOM and material prices. You can save these as quotes — useful when a potential customer asks "what would 10,000 units of X cost us?" and you need an answer that's grounded in real numbers, not gut feel.
This is especially valuable for new product development. Build a BOM, plug in your ingredient costs, and know your unit cost before you've produced a single unit. Price it with confidence, not hope.
What Changes When You Get COGS Right
The shift from estimated to calculated COGS changes how you operate:
- Pricing decisions are grounded in data. You know your actual unit cost. You set your price with a known margin. No more discovering you've been selling a product at a loss for six months.
- Supplier negotiations have leverage. When you can show exactly how a 10% price increase on a specific ingredient impacts your overall COGS, you negotiate differently than when you're guessing.
- Production waste becomes visible. Variance tracking turns "we think we're efficient" into "we overused ingredient X by 12% last month, costing us $4,200."
- Customer relationships are informed by profitability. Revenue is vanity. Margin is sanity. Knowing which customers actually contribute to your bottom line changes how you allocate sales effort.
- Financial reporting is continuous, not quarterly. When COGS is computed per order in real time, your P&L doesn't wait for month-end close. You always know where you stand.
The Bottom Line
Food manufacturers who calculate COGS from spreadsheets are flying blind on the metric that determines whether they make money. Ingredient costs change. Recipes evolve. Production floors don't execute with textbook precision.
The fix isn't more discipline with spreadsheets. It's a system that ties your BOMs to your material costs to your orders to your production actuals — and gives you margin visibility at every level.
That's what NovexERP was built to do.